IFRS
Group consolidated adjusted net income (IFRS)*1 for FY25.Q4 and FY26 Financial results forecast (IFRS)
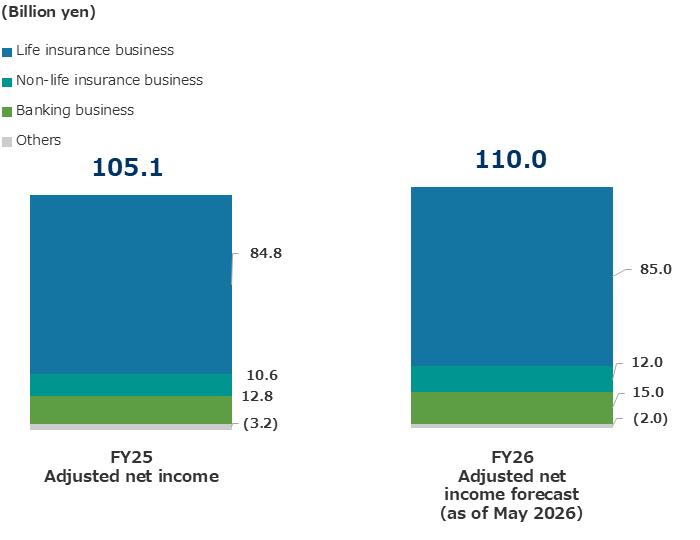
- Consolidated adjusted net income for FY25 was 105.1 billion yen (increased 71% year-on-year), mainly due to the increased adjusted net income in the life insurance and non-life insurance businesses.
- Consolidated adjusted net income forecast for FY26 is 110.0 billion yen (increased 5% year-on-year), mainly due to the increased adjusted net income in the banking and non-life insurance businesses, despite flat adjusted net income in the life insurance business.
Note1 SFGI consolidated net income - Adjustments for each entity
※
※Adjustments for each entity (post-tax) Sony Life: ①Investment income (net) related to variable insurance and foreign currency translation differences (excluding the equivalent of hedge costs) , ②Unrealized gains/losses related to variable insurance within insurance finance expenses (income) and foreign currency translation differences, ③Gains/losses on sales of securities, ④Other one-time gains/losses
SFGI, Sony Assurance, Sony Bank, Other entities: One-time gains/losses
J-GAAP
Financial Results Overview
Consolidated ordinary revenues increased 9.6%, compared with the previous fiscal year (year-on-year), to 2,871.0 billion yen, due to an increase in ordinary revenues from the life insurance, the non-life insurance and the banking businesses. Consolidated ordinary profit increased 88.4% year-on-year, to 84.5 billion yen, due to an increase in ordinary profit from the life insurance and the non-life insurance businesses, whereas ordinary profit from the banking business decreased. Profit attributable to owners of the parent decreased 29.6% year-on-year, to 55.4 billion yen.
Financial Position Overview
As of March 31, 2026, total assets amounted to 23,807.1 billion yen, increased 1.9% from March 31, 2025. Among major components of assets, securities, mostly government bonds, amounted to 18,558.5 billion yen, increased 5.9% from March 31, 2025. Loans amounted to 3,828.7 billion yen, decreased 1.8%.
Total liabilities were 23,177.9 billion yen, increased 2.1% from March 31, 2025. Major components of liabilities included policy reserves and others of 16,314.3 billion yen, increased 3.0%, and deposits totaled 4,600.1 billion yen, increased 8.4%.
Total net assets were 629.2 billion yen, decreased 6.0% from March 31, 2025. This included net unrealized gains (losses) on available-for-sale securities, net of taxes, which decreased by 28.2 billion yen, to (101.3) billion yen.